

Watch survey data bloom into brand stories
Goodbye pivot tables. Flowerplot turns raw survey data into insightful, on-brand marketing content.
Trusted by leading B2B teams

Meet the data storytelling platform built for marketing teams


Analyze, design, and publish your survey data effortlessly
Forget pivot tables and dizzying spreadsheets of raw data.
Just sync your survey data, then analyze and design in minutes, not hours.

Analyze
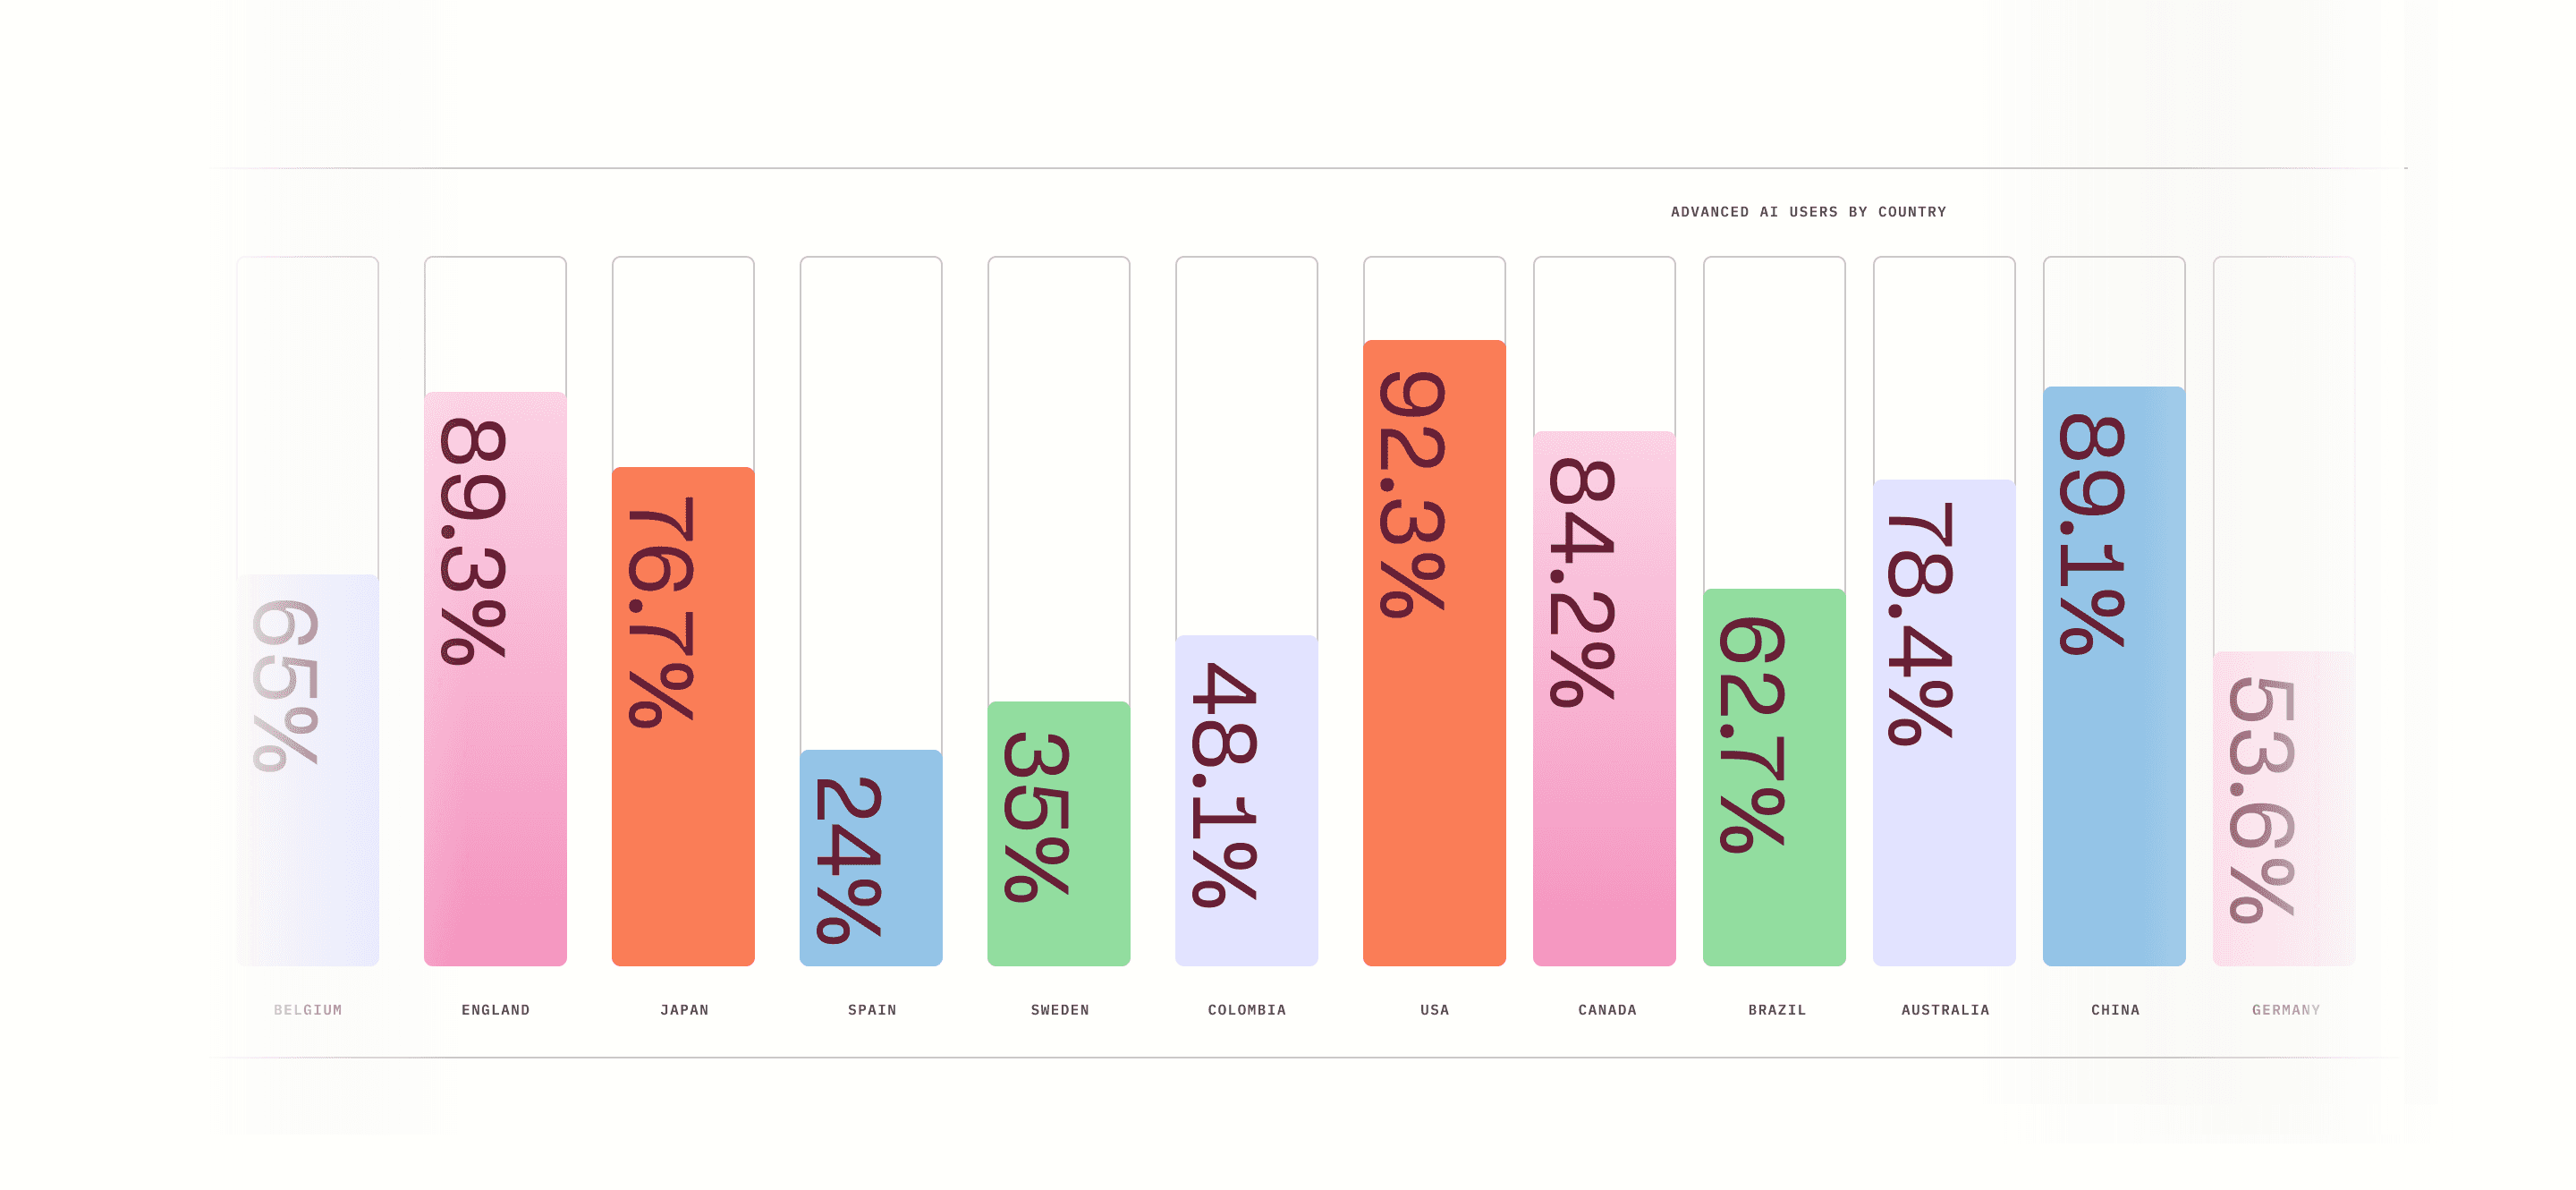
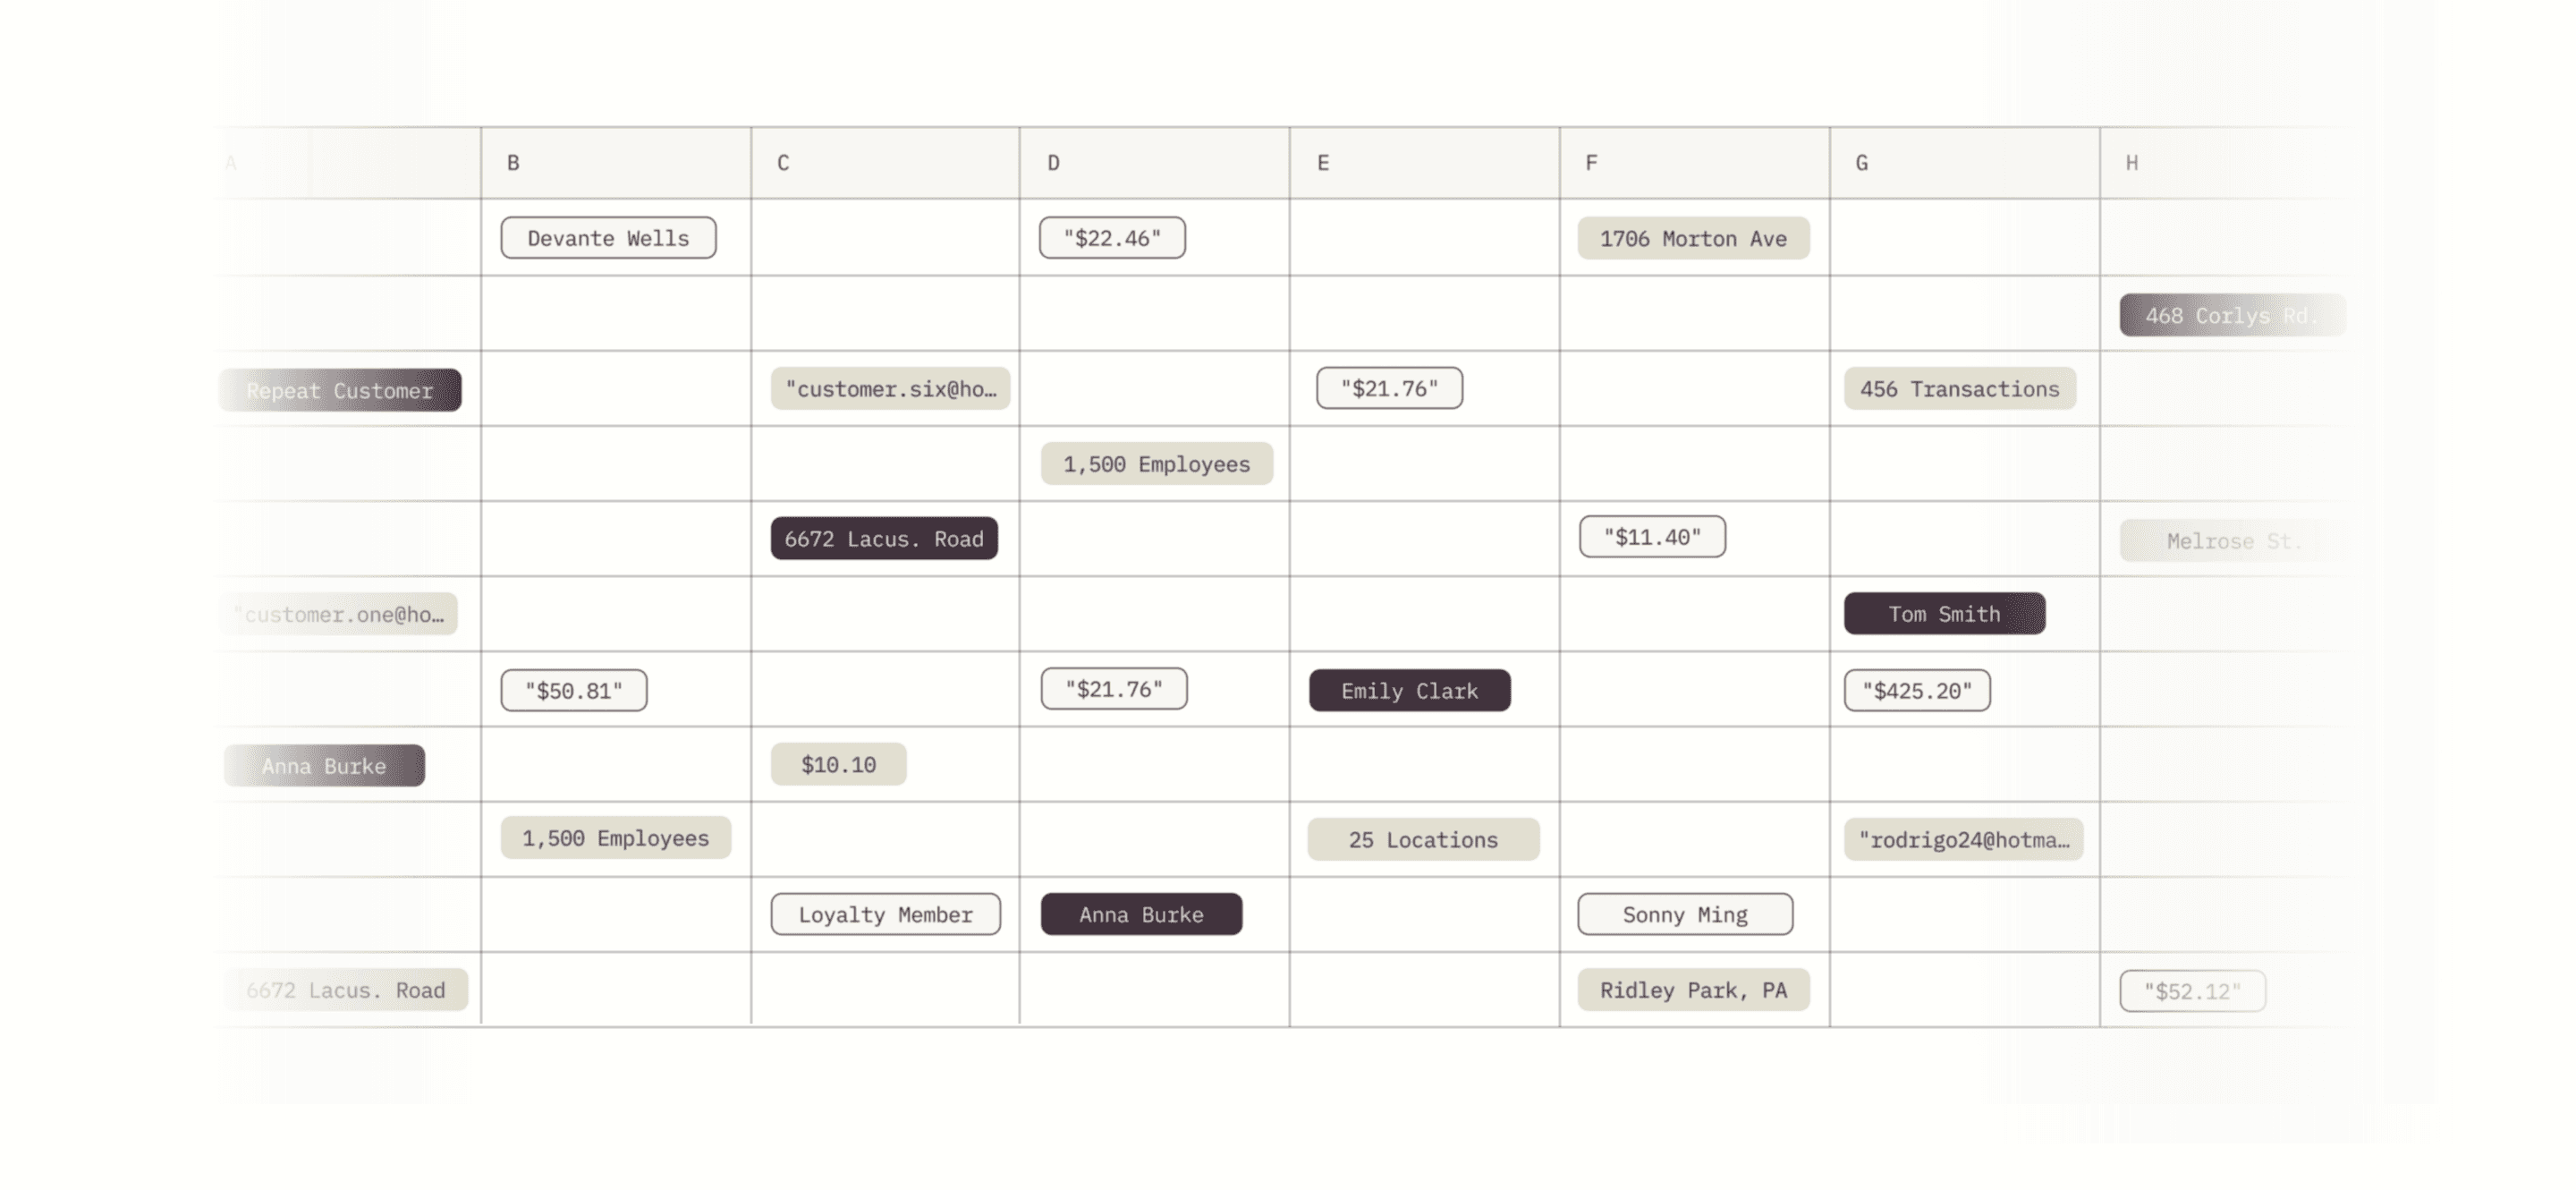
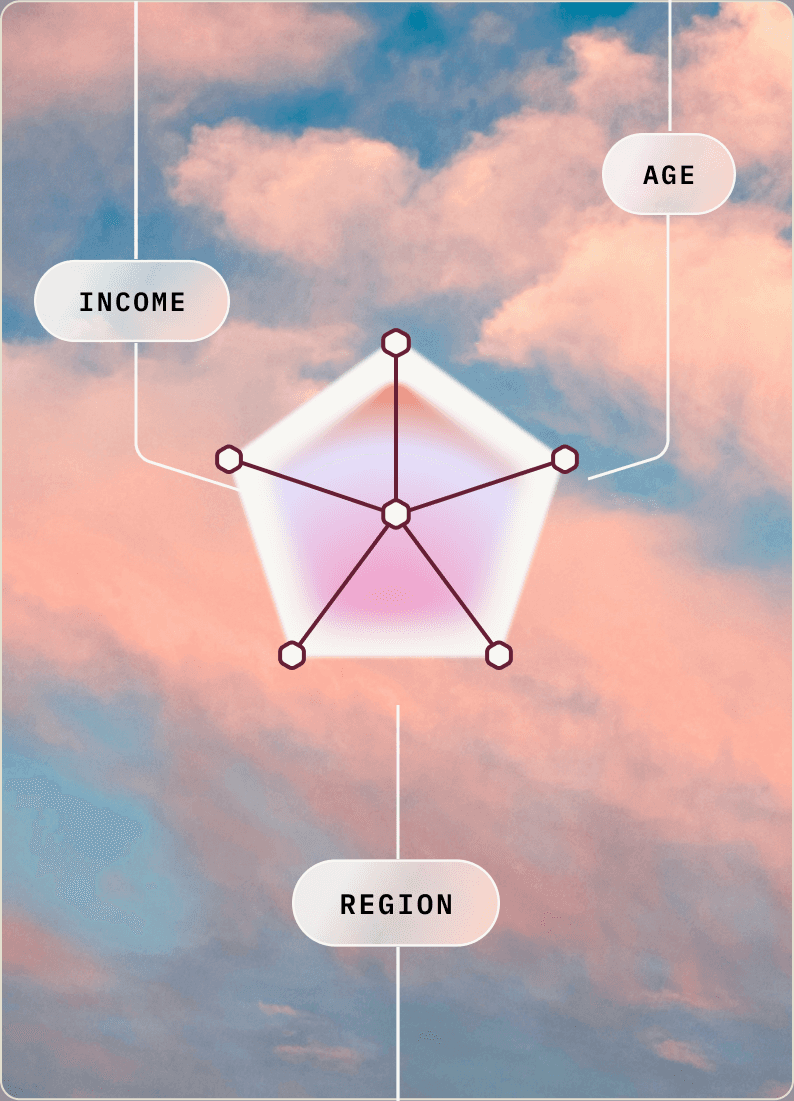
Dig into the cross-tabs of your survey data without an analyst. Filter and compare survey data by generation, region, AI adoption, or any other variable. Then surface the most statistically interesting findings automatically, or chat with your data to discover the insights yourself.


Design
Build on-brand visualizations straight from your survey data, and set your team up with approved presets. Design bar graphs, pie charts, and heat maps, and customize every detail, down to bar width, label sizing and placement, and grid lines.

Publish
Publish embeddable, interactive data visualizations in your web-based content, share live links to your published charts, or download graphics as SVGs, PNGs, or JPGs.

25
Hours saved
Compared to alternative analysis tools.
75%
Faster
Using Flowerplot to analyze compared to pivot tables.
80%
Of marketing teams
collect survey data and never end up using it.


Flowerplot uses security practices aligned with SOC 2 and ISO 27001 frameworks, and we never share your data.
SOC 2
ISO 27001
“I’ve been so impressed by Flowerplot. We can use it for so much. As a marketer, I’m used to prompting AI, but Flowerplot’s AI agent makes it easy to get started. It’s like having a data analyst partner to consult with. We went from getting into the tool to finding interesting insights quickly.”
